About Electricity Maps
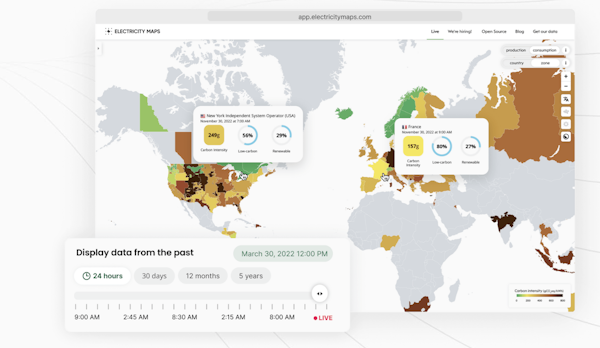
Electricity Maps is an API platform providing real-time and predictive electricity signals allowing any device to reduce their cost and emissions by informing them about the best time to consume electricity.
We’re, for example, used by Google to change the time and location of their datacenter energy usage, or by Samsung devices in their SmartThings Energy App (read more about our customer stories here). We recently raised €5M to accelerate our growth and are backed by world-class investors with experience from Unity, Zendesk, Datadog, Hugging Face, DocuSign and more.
The role is based in Copenhagen, one of the most live-able cities in the world.
The role
Electricity Maps aims to become the information layer for the world’s electricity system. We’re looking for a Data Scientist to help us build the best digital representation of the electricity system worldwide. You’ll be a key part of our effort to expand our product to cover new geographical regions, while at the same time maintaining high data quality and scientific standards. You will be a member of our Grid Modeling & Methodology team and report to the CTO.
You will:
Improve the quality and coverage of our data by implementing quality checks and estimation models.
Increase the trustworthiness of our data by ensuring that we stay up-to-date with developments in the field.
Explore better modeling techniques to help move us closer to the best digital representation of the grid.
Promote transparency by working with the community and publicly documenting our methodology.
Promote optimisation, testing and tooling for our processing pipelines.
Collaborate with engineers to build scalable systems.
To be successful in this role, you:
Have a strong theoretical understanding of statistics/probability theory/optimisation.
Have experience writing production code.
Are detail-oriented and organized.
Thrive in an environment that provides autonomy, that supports your individual growth with interesting tasks.
Possess a pragmatic and honest communication style.
Want to work with a team with a variety of backgrounds and skill sets.
Bonus: have experience working with the energy sector.
If you don't check all the boxes above but you like the position, please apply because we value experience in many different ways.
Compensation & Benefits:
Salary: 48500 DKK/month depending on experience
Stock options
6 weeks of paid holidays
Paid lunch when working from the office
Health insurance and insurance covering loss of ability to work
Parental leave
A huge opportunity for career growth as you’ll help shape a market-defining product
What’s the interview process like?
It starts the same for every candidate: getting to know each during a short intro talk where we will discuss practicalities, cultural fit/add and answer any first questions you might have. Next steps can vary by role, but will include an interview with a focus on the technical requirements for the role, an interview with a focus on team fit/add and cultural fit/add and a founder interview. Other assessments can be part of the process (e.g. a coding interview for an engineer, a portfolio review for a designer, deeper experience meetings for other roles). We prioritize transparency and honesty throughout the process.
Perks and benefits
This job comes with several perks and benefits

Paid holiday

Work life balance

Near public transit

Social gatherings

Healthcare insurance

Free lunch
Working at
Electricity Maps