
Electricity Maps
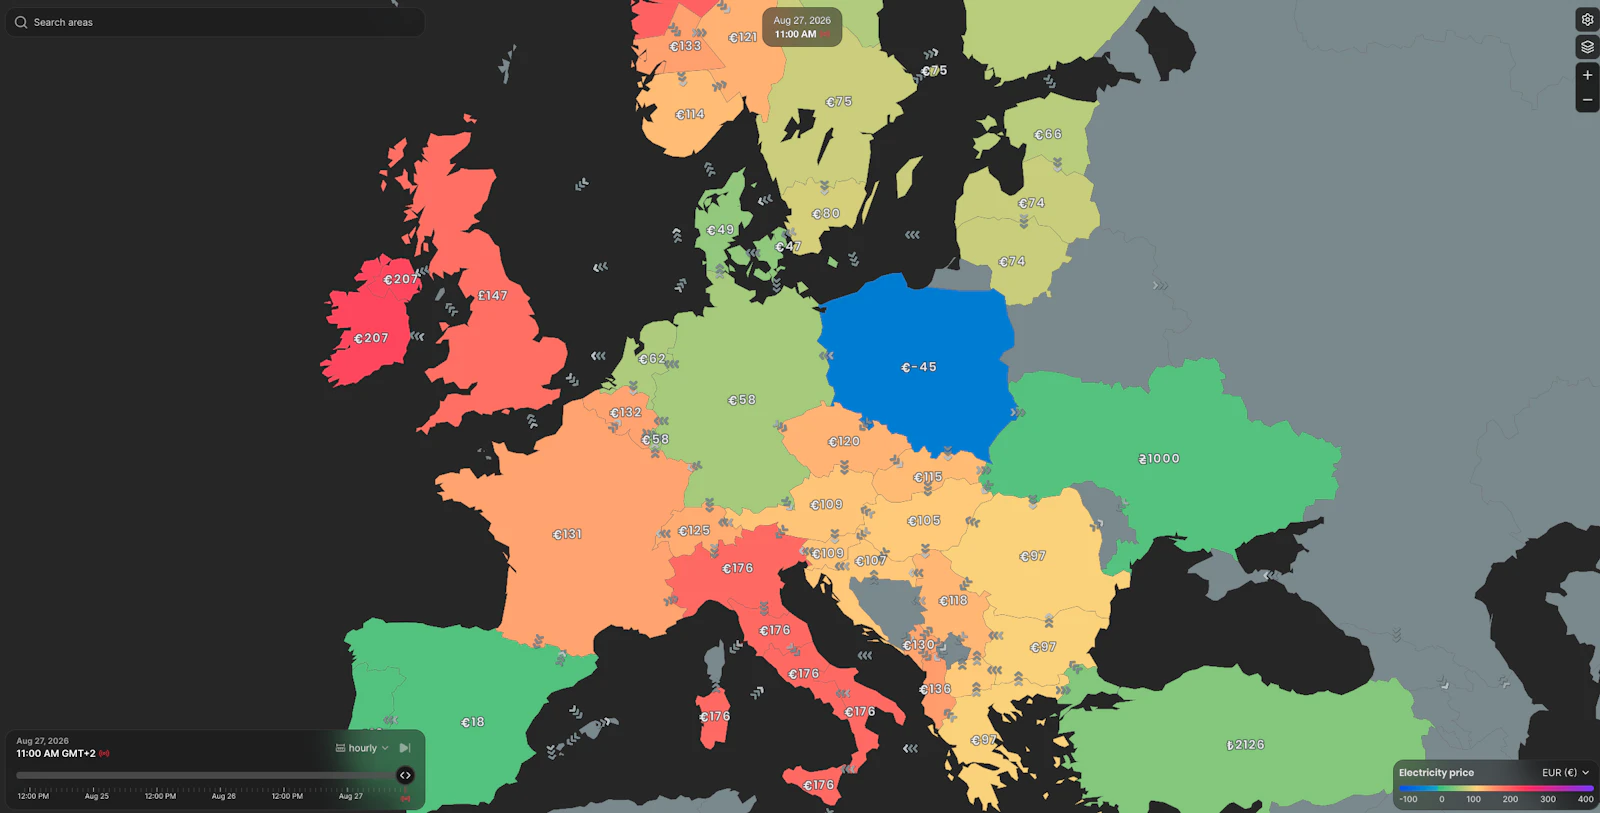
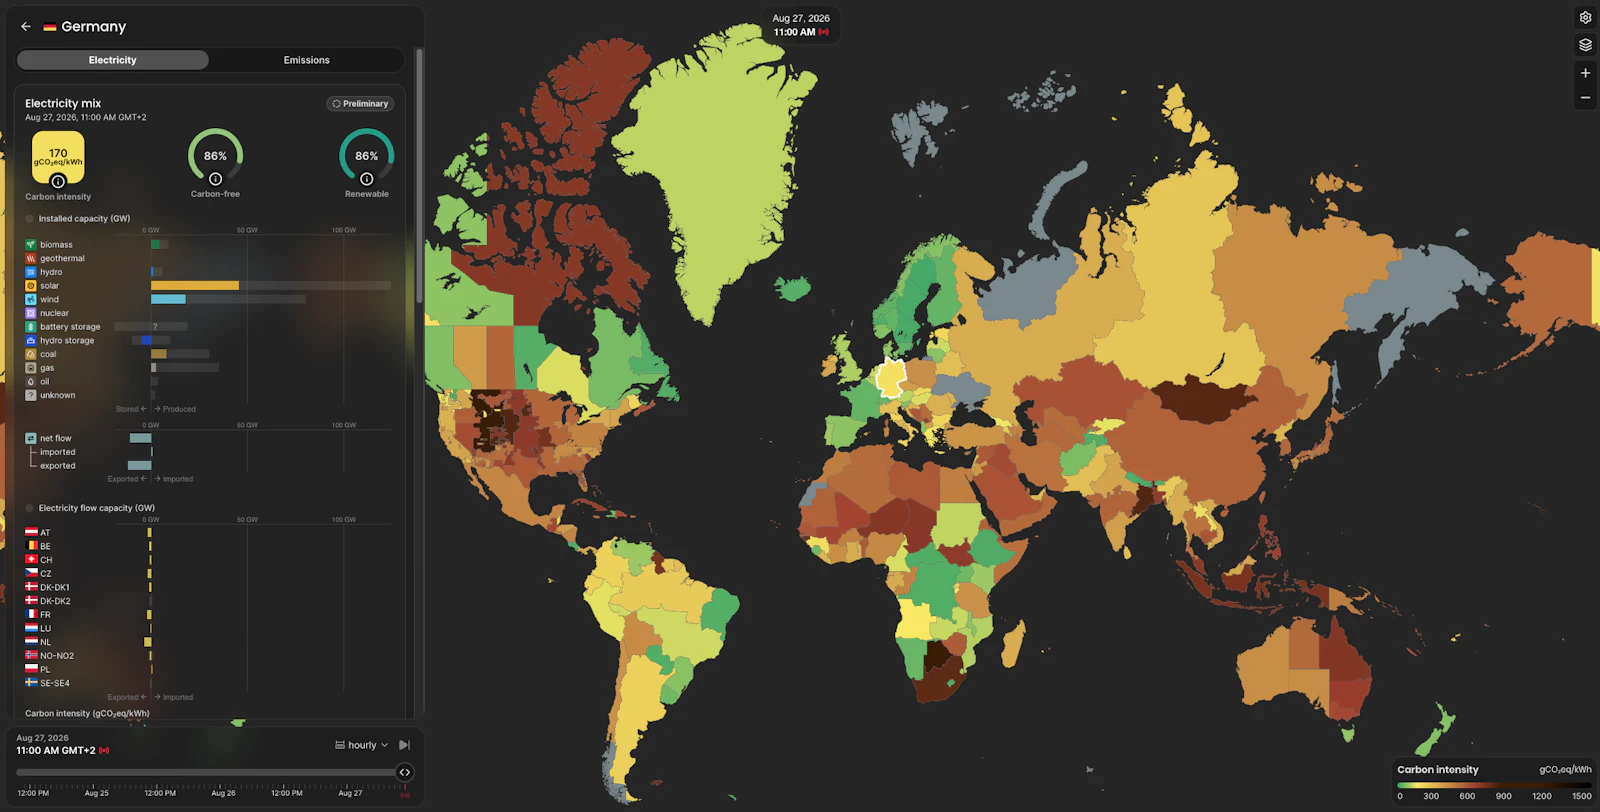
Electricity Maps provides real-time, historical, and forecasted electricity data - including carbon intensity, electricity mix, and prices - for more than 350 regions worldwide. We help businesses cut emissions with confidence, and enable products and services to differentiate by giving end-users the tools to be carbon-aware. We also serve power markets directly: energy traders and market participants use our forecasts to anticipate prices and grid conditions ahead of time.
Wind and solar output fluctuates throughout the day, so this data has to be dynamic and updated in real time. And because claims about the physical origin of electricity get scrutinized and challenged, the effort behind it has to be collaborative, open, and transparent - otherwise it's just another unverifiable "100% renewable" claim.
That's what motivated Electricity Maps. It started as an open-source real-time visualization in June 2016, founded by Olivier Corradi, and has grown into a comprehensive data platform trusted by companies like Google, Cisco, and Schneider Electric to hit their climate goals and help their users take real, grid-grounded climate action.
Our mission: to decarbonise electricity, by building and continuing to build the world's most comprehensive, granular, and useful electricity data platform.
| Location | Denmark |
| Website | electricitymaps.com |
| Founded | 2016 |
| Employees | 11-50 |
| Industries | Energy & Greentech, IT & Software |
| Business model | B2B |
| Funding state | Series A |
Working at
Electricity Maps
This job comes with several perks and benefits

Paid holiday

Work life balance

Near public transit

Social gatherings

Healthcare insurance

Free lunch
SDGs



Team
SL
People Operations Assistant
Sylvester Lundquist
TH
Talent Lead